Ink Test Page
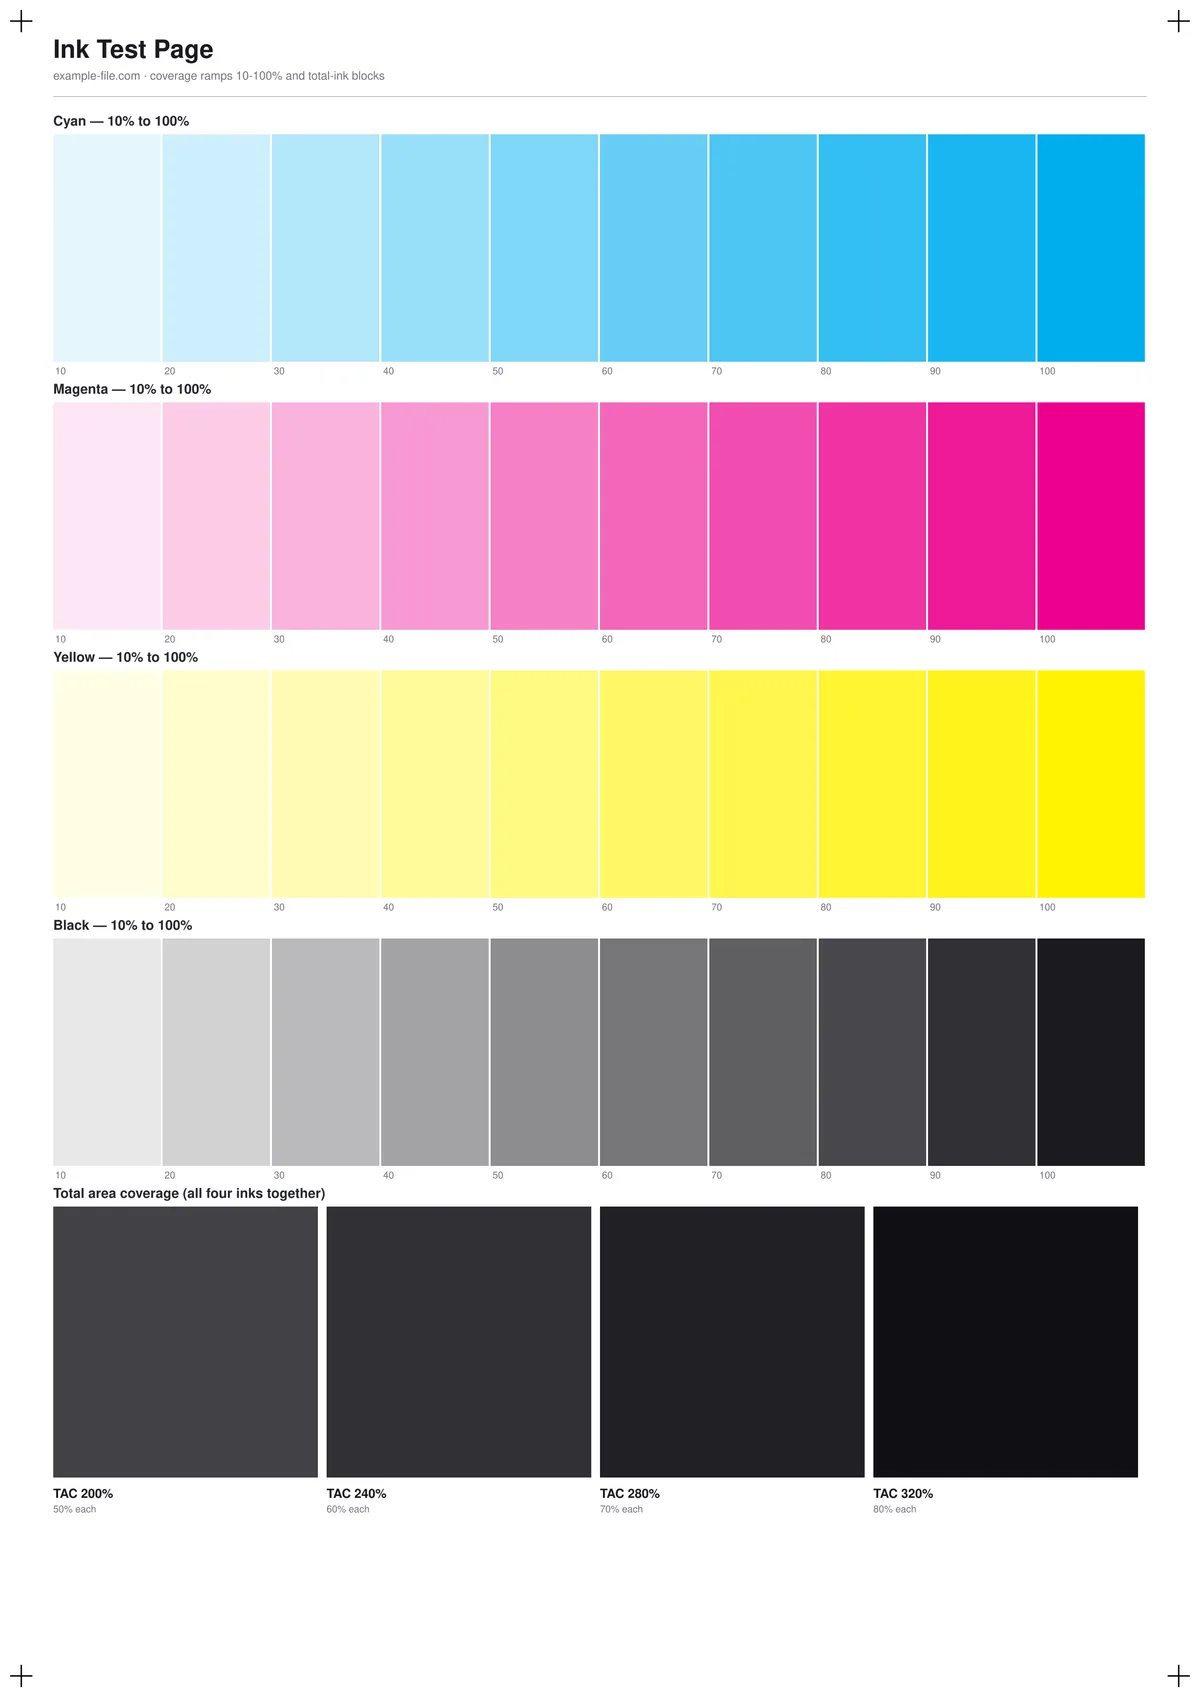
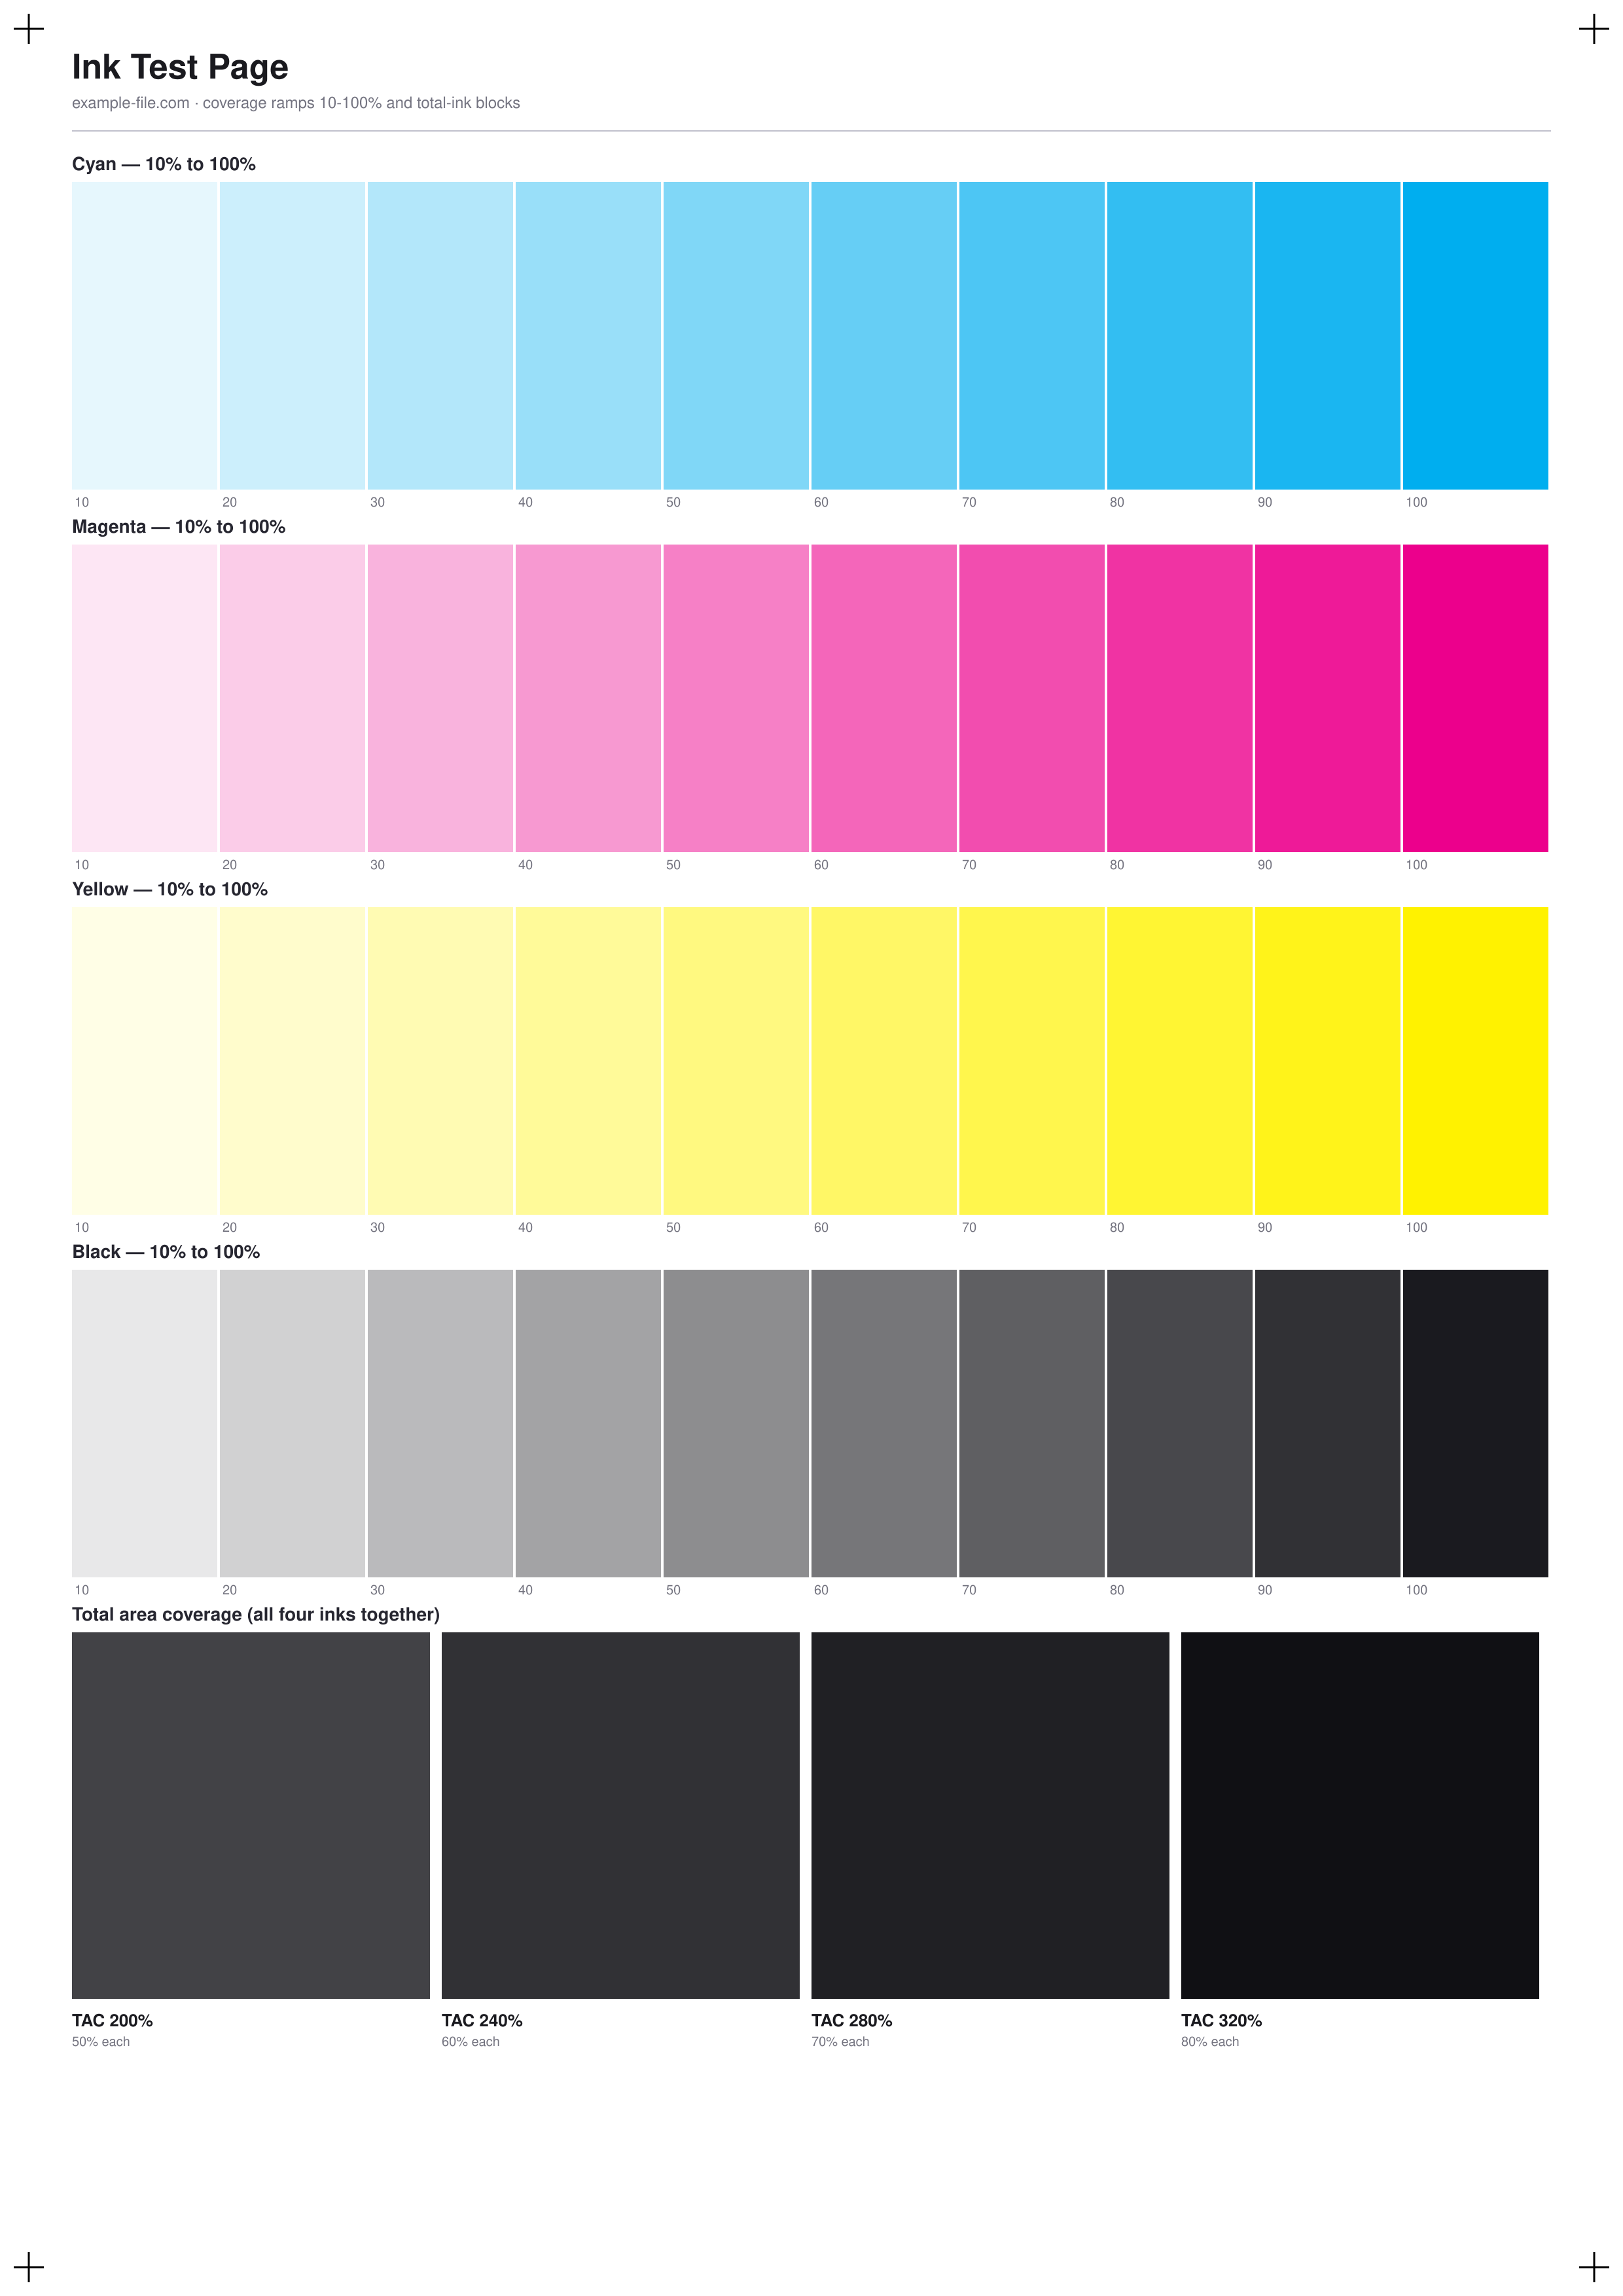
A sheet for finding out how much ink your printer actually puts down, and where it stops coping. Each of the four inks gets its own ramp from 10% to 100% in ten steps, so you can see banding, dot gain and where a channel starts clipping. Below them, four total-area-coverage blocks stack all four inks together at 200%, 240%, 280% and 320% - the range where pooling, offsetting and slow drying start to appear on real paper.
What these files actually are
The PDF's ramps and blocks are true DeviceCMYK drawn with pdf-lib, so each step's ink percentage is embedded in the file and readable in Acrobat's Output Preview or any RIP - a 40% cyan patch really is 40% cyan, not an RGB colour chosen to look like it. The PNG is a 300dpi screen approximation of the same layout; its steps are naive RGB tints and will not match a printed proof, so use it for reference and print the PDF for anything you intend to measure.
-
Downloadink-test-page-a4.pdfPDF · 3.2 KB VirusTotal report
-
Downloadink-test-page.pngPNG · 253 KB VirusTotal report
Are these files safe to download?
Every sample file is generated by us — no executable code, no macros. Files are served over HTTPS from our CDN, each with a SHA-256 checksum so you can verify your download and a link to an independent VirusTotal scan report.
Check this site independently:
How to print this test sheet
- Print the PDF at 100% scale with all colour correction, "enhance" and toner-save options switched off - every one of them will alter the coverage you're trying to measure.
- Read each ramp for evenness first. The steps should get darker in equal-looking increments; a jump between two steps, or a ramp that stops changing near the top, points at a channel that's clipping or a cartridge that's low.
- Look for banding within a single step. Horizontal stripes inside what should be a flat tint usually mean a nozzle, drum or feed problem rather than a settings problem.
- Give the total-coverage blocks a few minutes, then touch them and press a clean sheet against them. The block where ink transfers, stays tacky, or makes the paper cockle is past your practical ink limit.
- Compare the 320% block against the 200% one on the same sheet. If they look equally black, your job never needed the extra ink - which is the entire point of measuring rather than guessing.
- Run the same sheet on the stock you'll actually use. Ink limits are a property of the paper as much as the printer, and a coated sheet will hold coverage that an uncoated one turns into a puddle.
Common use cases
Finding a printer's real ink limit
Print the coverage blocks and find the first one that won't dry cleanly - that's your working TAC ceiling, which is usually lower than the number in the spec sheet.
Checking a cartridge before a big run
A ramp that flattens out at the top end shows a channel running low well before the printer's own ink indicator admits it.
Comparing paper stocks
Run the identical sheet on two stocks to see how much more ink the coated one holds before pooling - useful when quoting or choosing paper for a job.
Diagnosing banding
Flat tints at known percentages are the cleanest way to expose banding, because there's no image detail to hide it.
Frequently asked questions
- What is TAC, and why does it matter?
- Total area coverage is simply the four ink percentages added together, so 80% of each ink is TAC 320%. It matters because paper can only absorb so much liquid: past a certain point ink stops drying, transfers onto the next sheet, and warps the paper. The blocks on this page let you find that point physically rather than trusting a number.
- Why does my 100% patch look lighter than I expected?
- Most likely something in the chain is trying to help - driver colour management, a toner-save mode, or a "vivid" preset. Turn them all off and reprint. If it's still light, the channel is genuinely low or the printer is capping coverage internally.
- Is this the same as the CMYK printer test chart?
- They overlap but answer different questions. The CMYK chart is about per-channel accuracy at four reference percentages, aimed at prepress. This page is about volume: how much ink lands, in ten steps per channel, and how much the paper can take before it fails. If you want to check colour, use the chart; if you want to check ink laydown and drying, use this.
- Why are the total-coverage blocks equal splits rather than realistic separations?
- So the labels mean something unambiguous. A real image at TAC 280% distributes ink unevenly across the four channels, which makes it a poor measuring stick. Equal splits make each block a clean, reproducible test of one number.
- Can I use the PNG to measure coverage?
- No. The PNG's tints are RGB approximations for on-screen reference - they can't carry ink percentages. Print the PDF for anything you plan to measure, inspect, or show a printer.
More printer test images
- Printer Alignment Test Page — Free Printable PDF (A4)
- Rich Black CMYK Test — Free Black Formula Chart (PDF/PNG)
- CMYK Printer Test Chart — Free Ink Patch Chart (PDF/TIFF)
- Inkjet Printer Test Image — Free Nozzle Check Pattern (PDF/PNG)
- Printer Test Image — Free Printable Test Page (PDF/PNG)
- Laser Printer Test Image — Free Halftone & Toner Test (PDF/PNG)