Print Resolution Test Image
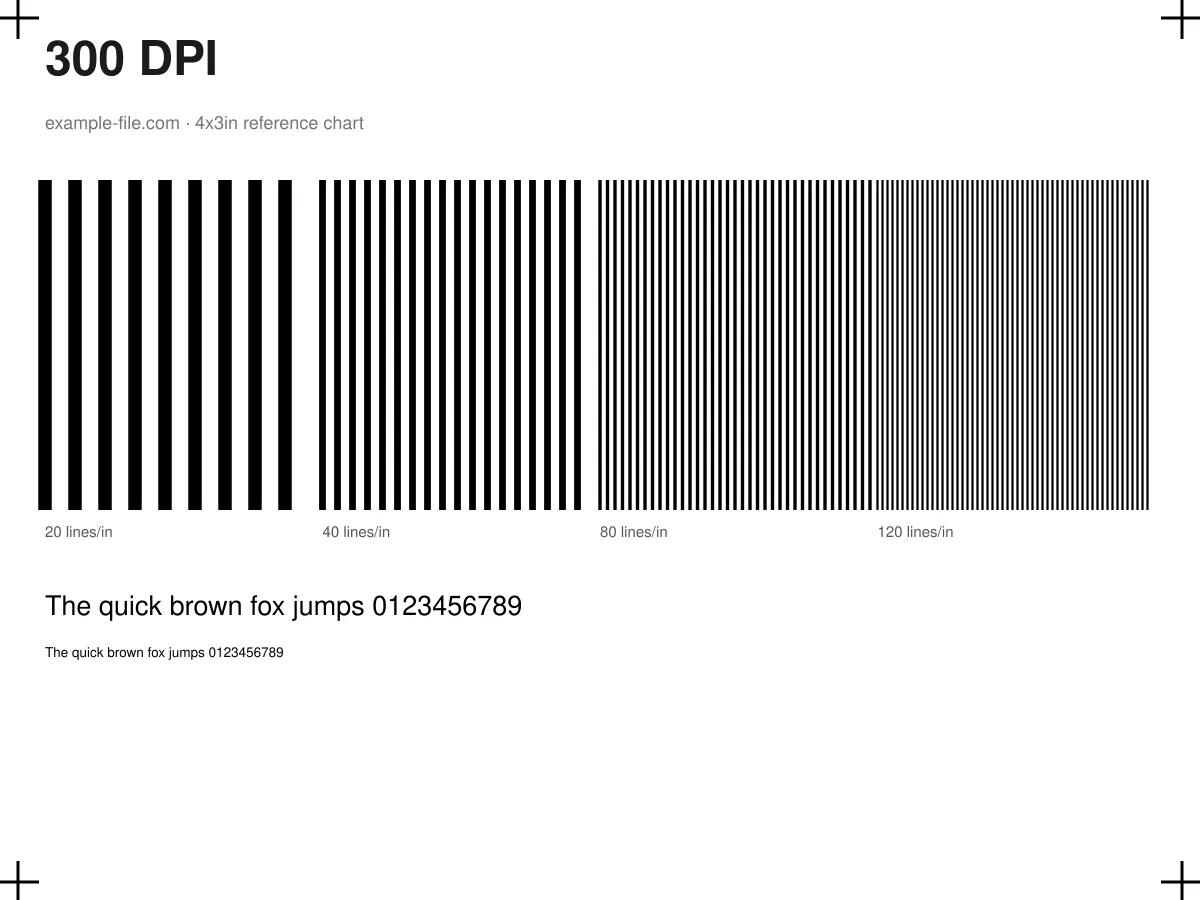
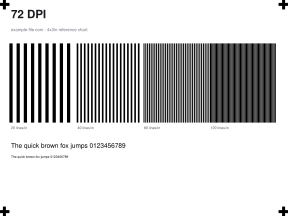
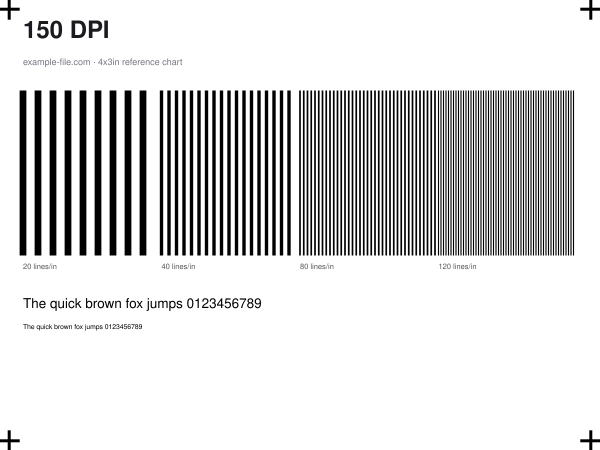
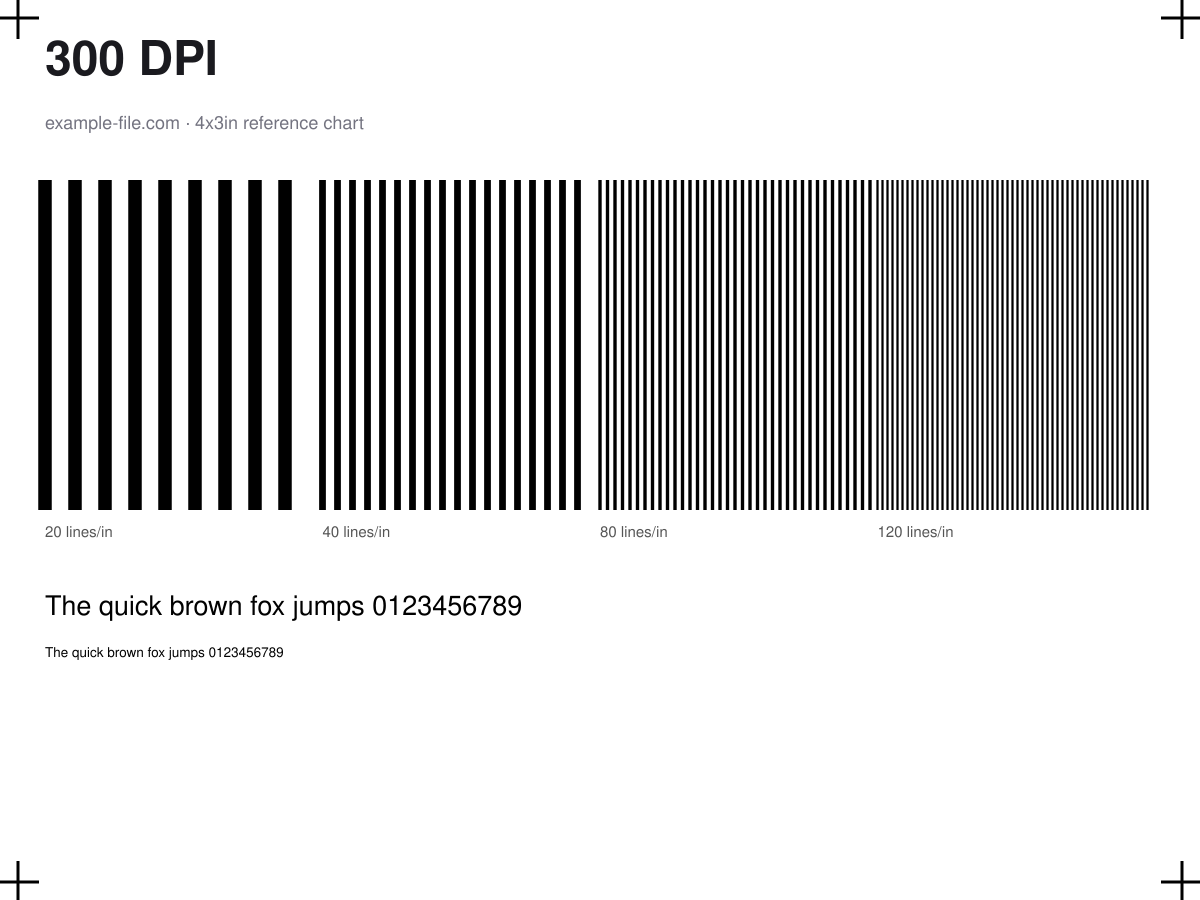
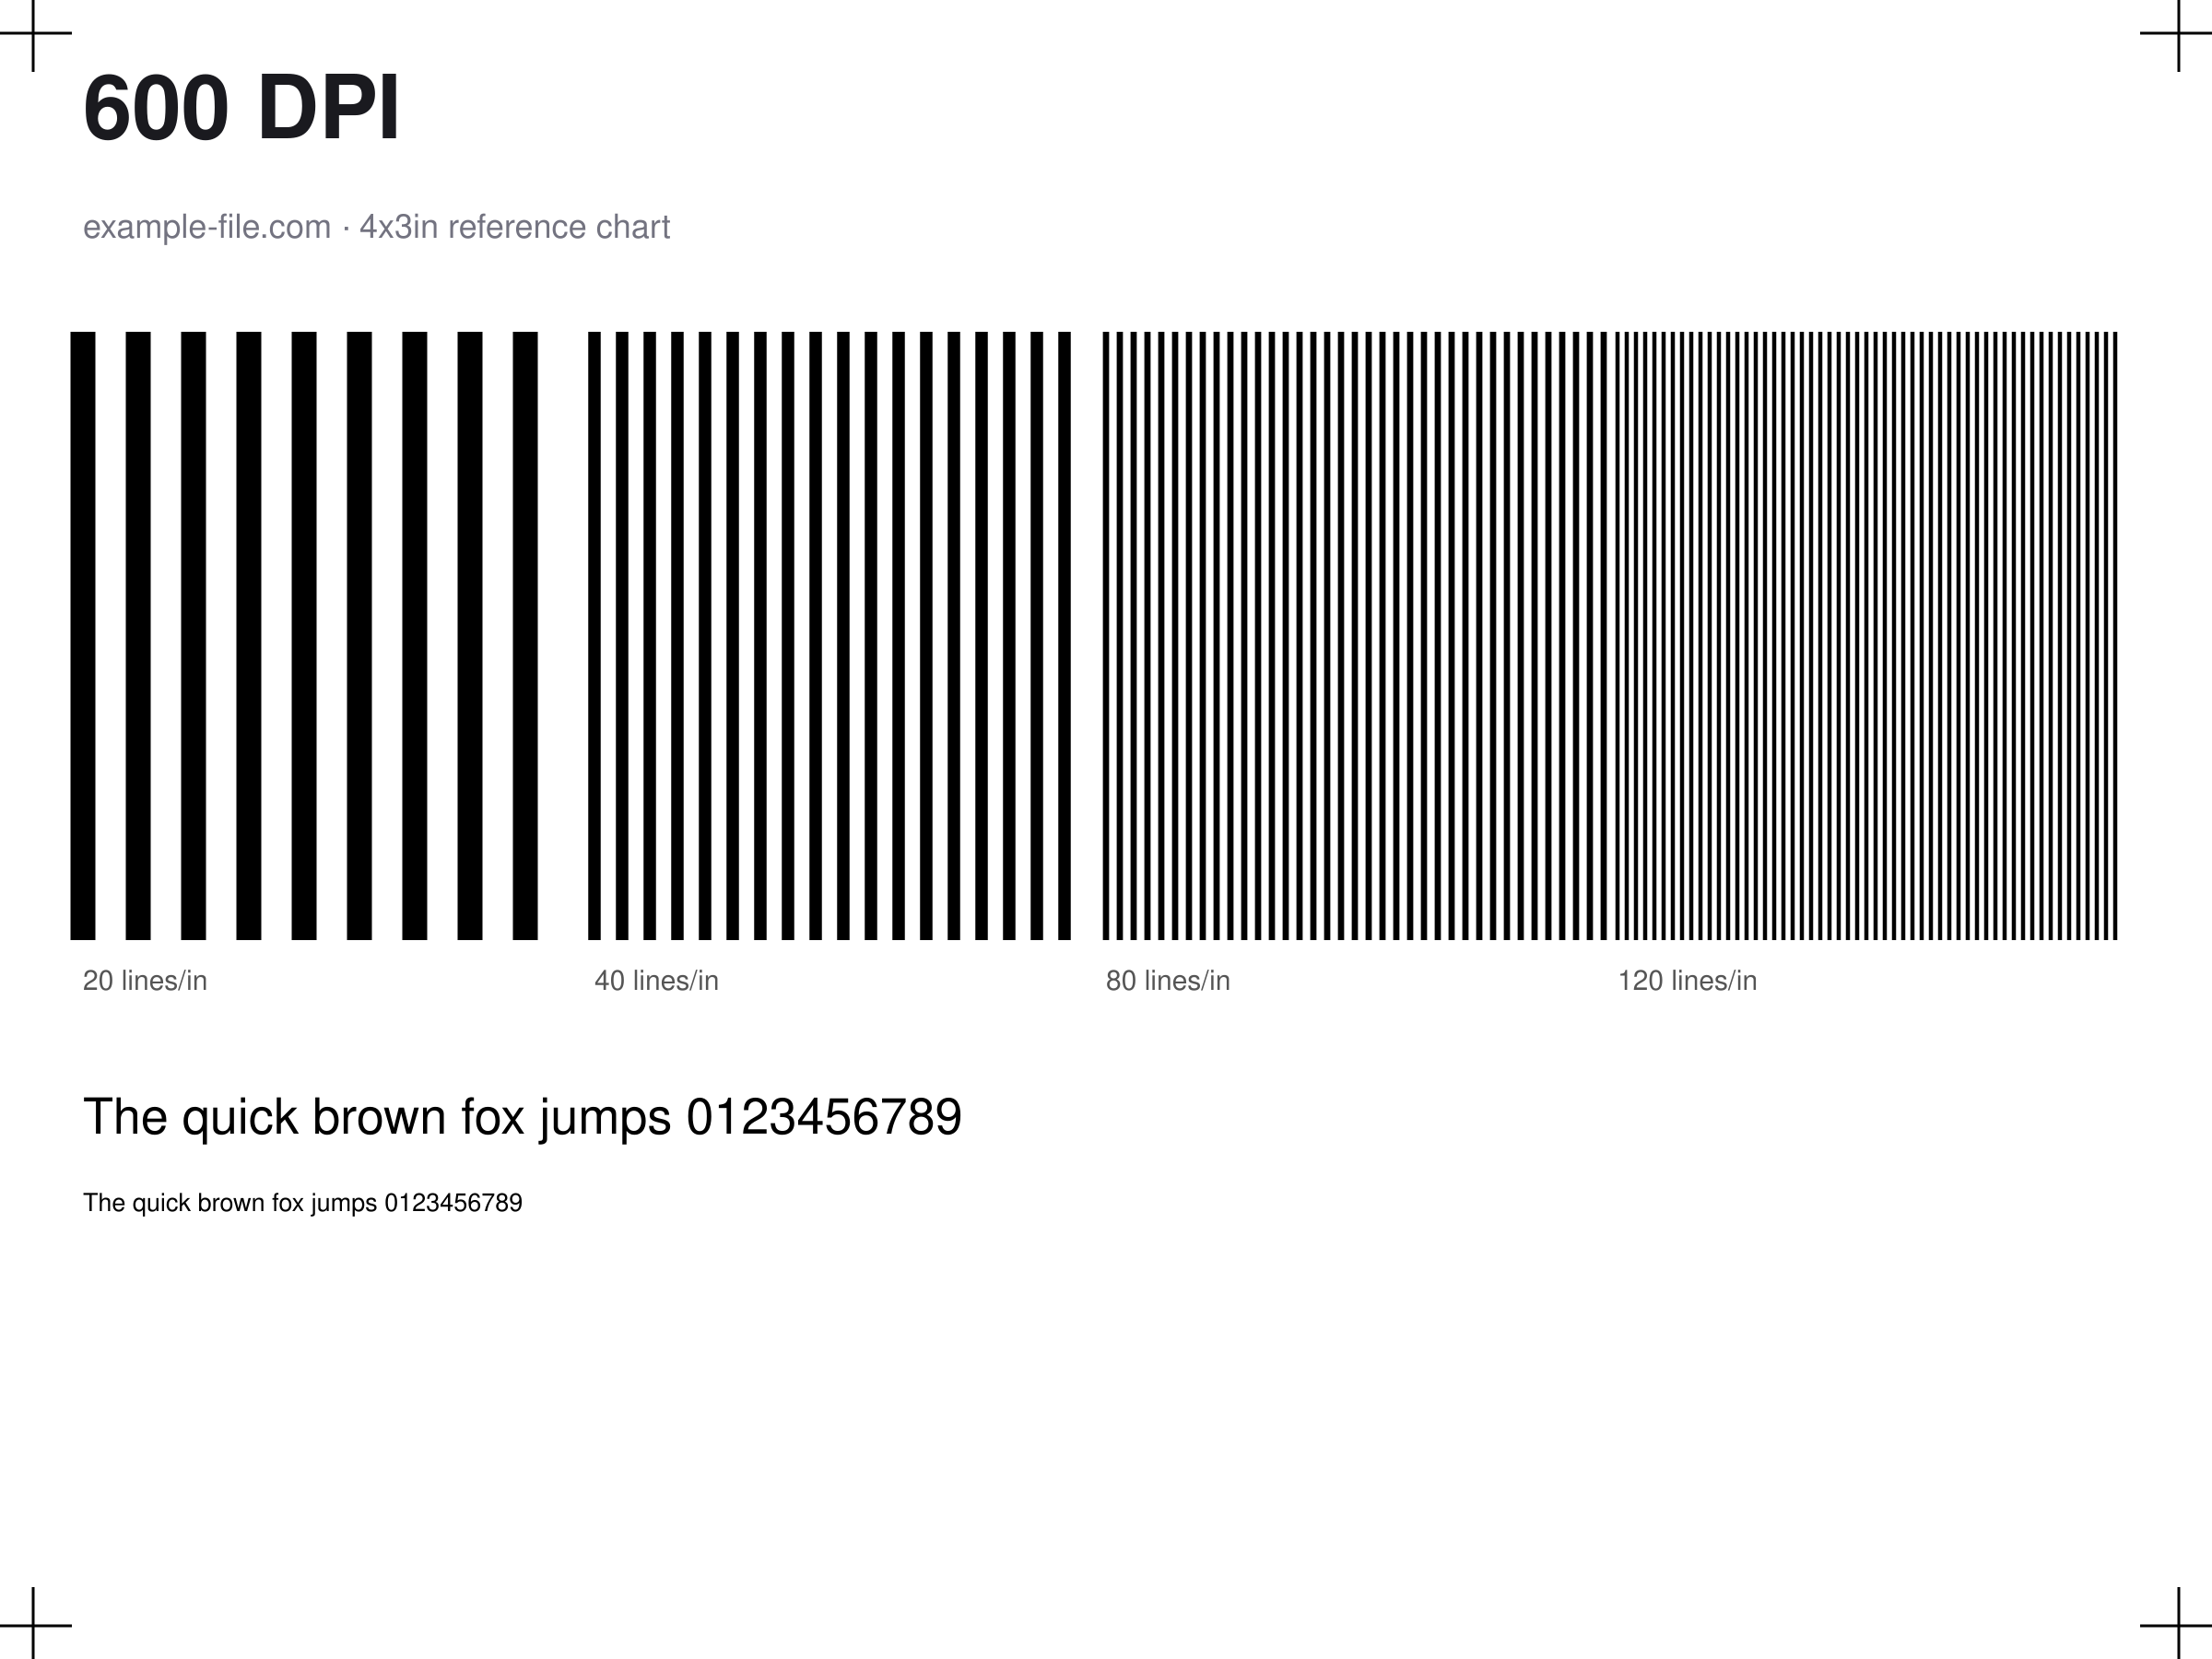
The same 4x3-inch chart - line-pair groups at 20, 40, 80, and 120 lines per inch, plus a text sample - rendered natively at four different resolutions: 72, 150, 300, and 600 DPI. Because every version is the same physical size, comparing them shows exactly how many real pixels are available to reproduce fine detail at each DPI, rather than just resizing one image and calling it a resolution test.
What these files actually are
Each DPI version is rendered fresh from its own vector source at that exact resolution - the 72dpi file isn't a downscaled copy of the 600dpi one, so the pixel differences you see are genuine, not an artifact of resampling. The A4 PDF embeds the real 300dpi chart at true size using pdf-lib.
-
Downloadprint-resolution-chart-72dpi.pngPNG · 5.7 KB VirusTotal report
-
Downloadprint-resolution-chart-150dpi.pngPNG · 15 KB VirusTotal report
-
Downloadprint-resolution-chart-300dpi.pngPNG · 40 KB VirusTotal report
-
Downloadprint-resolution-chart-600dpi.pngPNG · 108 KB VirusTotal report
-
Downloadprint-resolution-chart-a4-300dpi.pdfPDF · 37 KB VirusTotal report
Are these files safe to download?
Every sample file is generated by us — no executable code, no macros. Files are served over HTTPS from our CDN, each with a SHA-256 checksum so you can verify your download and a link to an independent VirusTotal scan report.
Check this site independently:
How to print this test sheet
- Open the 72dpi and 600dpi PNGs side by side at their native pixel size (not scaled to fit your screen) - the difference in how many of the four line-pair groups remain distinct is the whole point.
- Print the A4 PDF at 100% scale - the embedded chart should measure exactly 4 x 3 inches on paper, letting you check your printer's actual output at a known, true 300dpi.
- As a rule of thumb, 300dpi is the common minimum for sharp text and fine detail in print, while 150dpi is often the practical floor for large-format prints viewed from a distance - anything near 72dpi (screen resolution) will look visibly soft at close range.
- If you only care about a specific use case, check: 300dpi for documents/photos, 600dpi if you need to verify fine-line reproduction, and 72/150dpi to see what "too low" actually looks like.
- For color accuracy rather than resolution, see the photo printer test image or the color printer test page.
Common use cases
Choosing a safe minimum resolution
Compare the four DPI versions to decide what's actually necessary for a specific print job, instead of defaulting to the highest resolution available out of caution.
Diagnosing a client's "blurry print" complaint
Use this comparison to show a client or colleague concretely why a low-resolution source image looks soft when printed at a larger size.
Print pipeline / RIP resolution testing
Feed each DPI version through a print pipeline or RIP to confirm it's handling resolution scaling and interpolation the way you expect.
Large-format print planning
Use the 150dpi and 72dpi comparisons to judge acceptable detail loss for posters or banners viewed from a distance, where full 300dpi often isn't necessary.
Frequently asked questions
- Why does the 72dpi version look so much worse even though it's 'only' 4x smaller in DPI than 300?
- DPI differences compound in area, not just in a single direction - going from 300 to 72dpi is roughly a 17x reduction in total pixel count for the same physical size, not 4x, which is why fine detail disappears so quickly.
- Is higher DPI always better?
- Not necessarily - beyond a certain point (usually around 300-600dpi depending on the printer and viewing distance), more DPI mostly means a larger file with no visible quality improvement. Very high DPI matters most for fine text, line art, and close-up viewing.
- Why is the print-ready file only available at 300dpi?
- 300dpi is the practical sweet spot for most real-world printing - the PDF is meant to verify your printer reproduces that standard resolution accurately at true size, rather than to test every DPI value in a physical print.